Logs and Traces
RocketAiFlow uses OpenTelemetry-based monitoring so teams can inspect what happens across workflow execution, telephony behavior, API actions, runtime services, and supporting infrastructure.
Logs and traces should be read together. Logs show event detail: what happened, when it happened, which service produced it, and which metadata was attached. Traces show the path: how the same operation moved across services and where latency, failure, or unexpected behavior started.
Why they belong together
In production investigations, a single log line is rarely enough. A trace without the related log context can also be too abstract. Using both gives operators a clearer view of:
- call launch and campaign execution events
- trunk, endpoint, and telephony state changes
- function and API action behavior
- service latency and error paths
- metadata such as campaign, contact, operation, result, service name, and trace identifiers
Grafana Drilldown
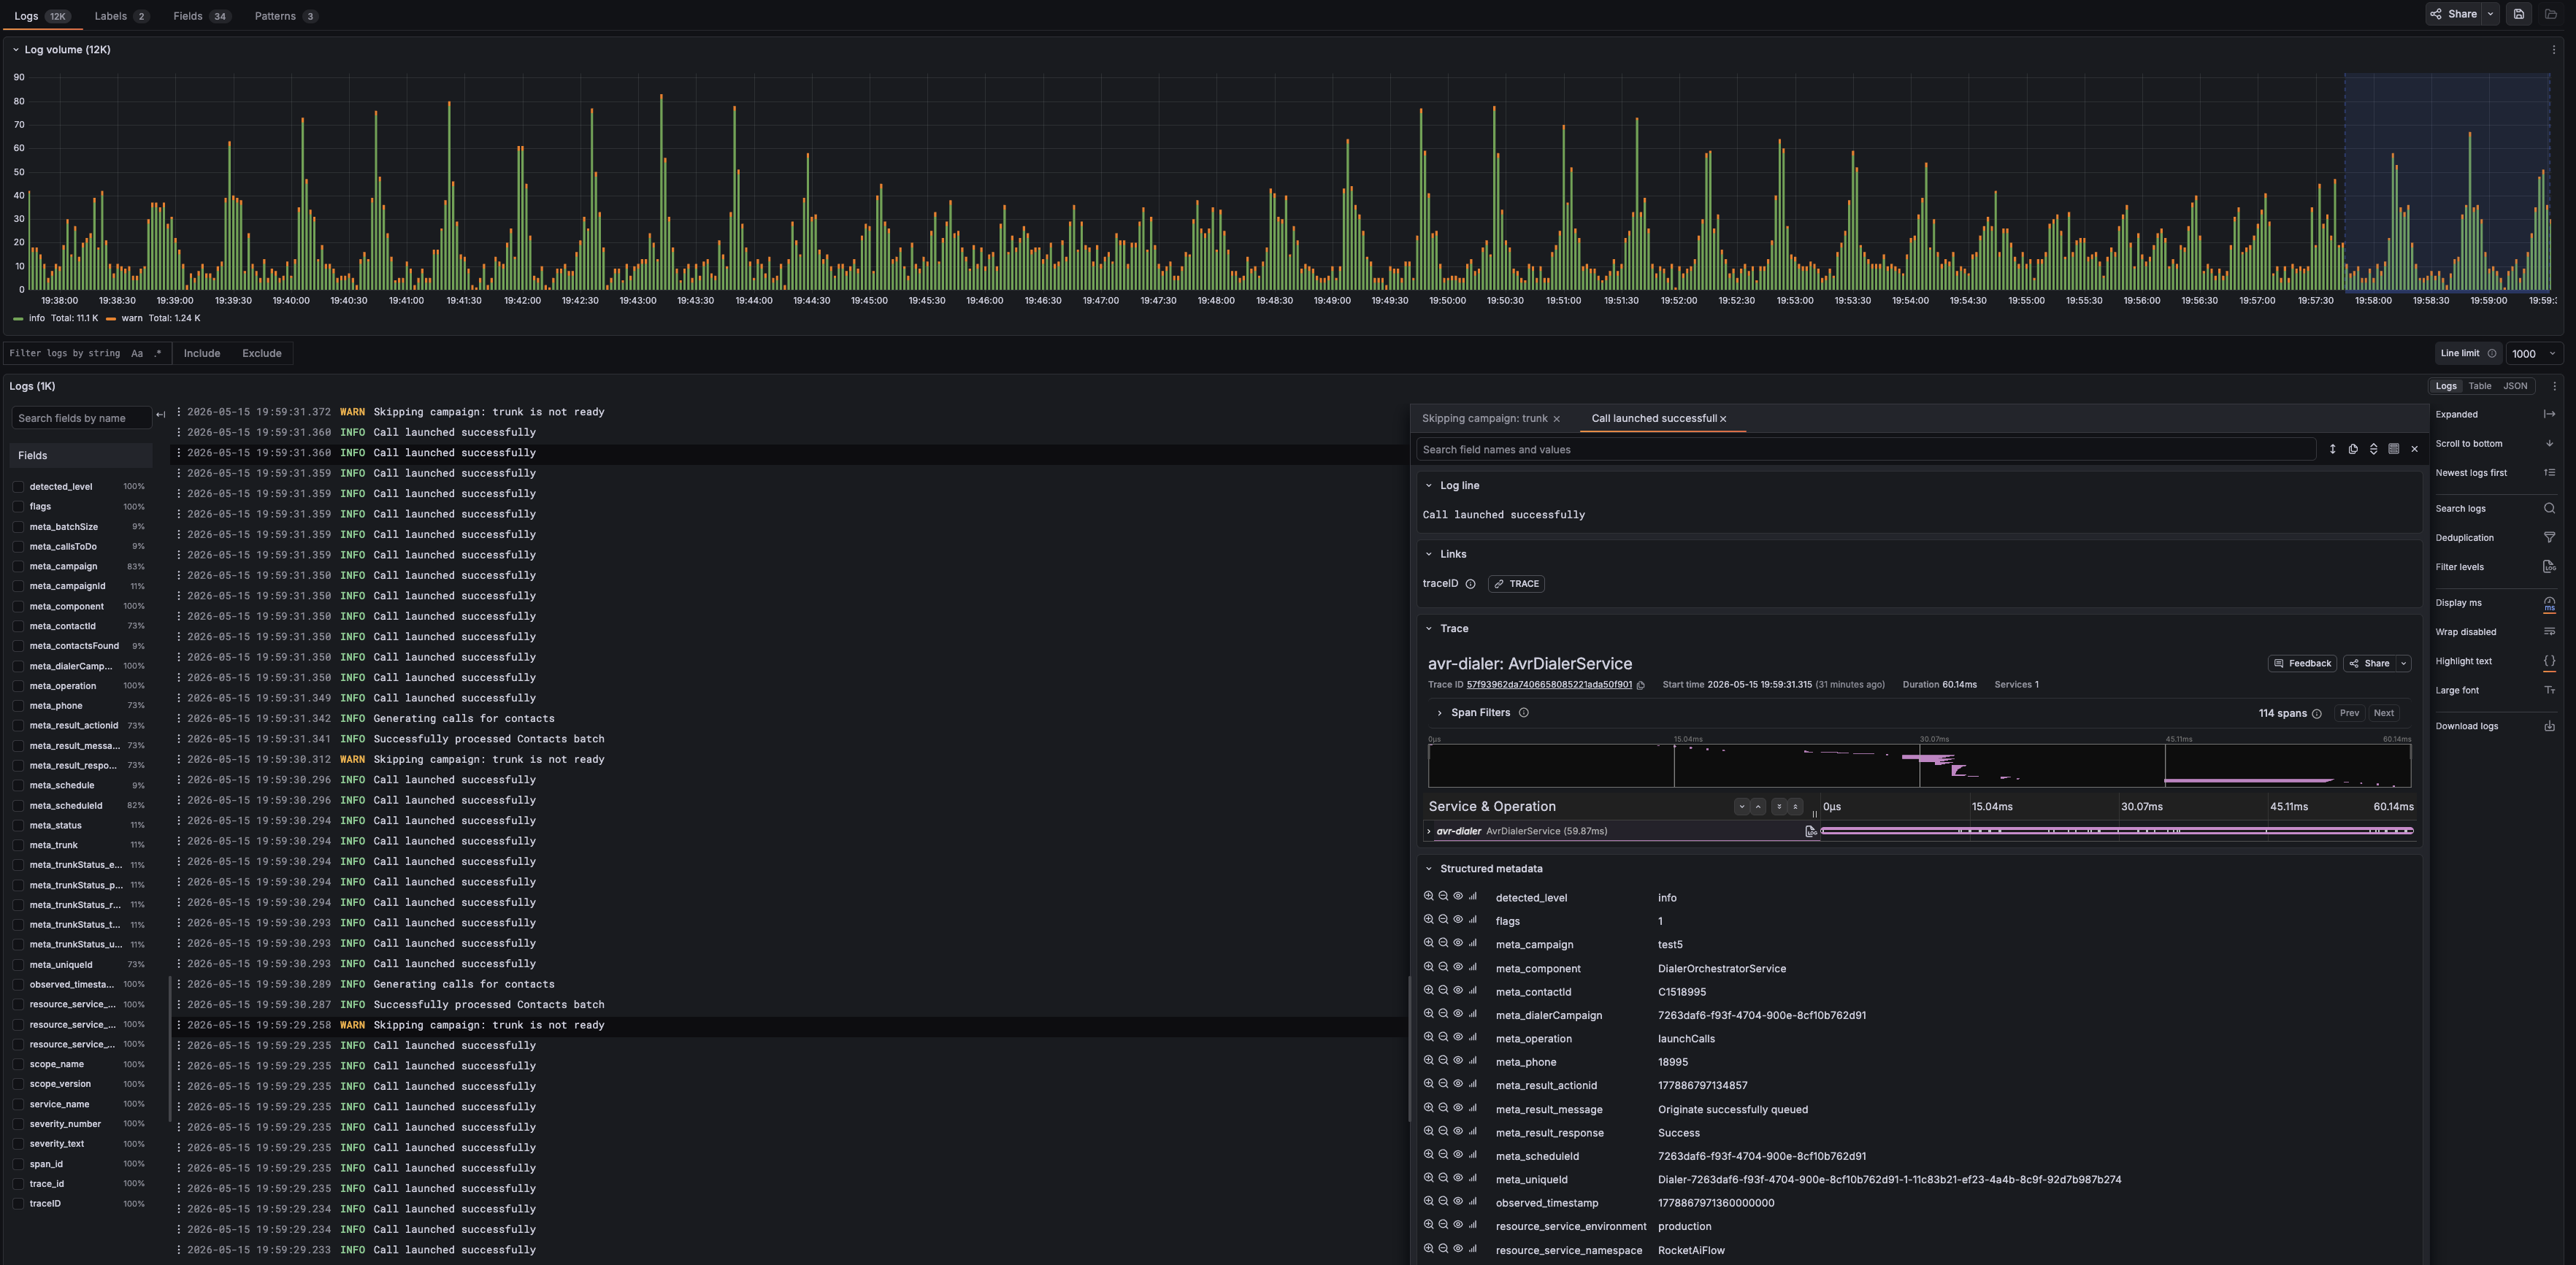
Grafana Drilldown is the advanced review surface for log and trace investigation. Use it when dashboards show that something changed and you need to filter, search, and correlate the supporting events.
- filter logs by level, service, fields, labels, and time range
- search inside log messages and structured metadata
- open a log event and follow the linked trace ID
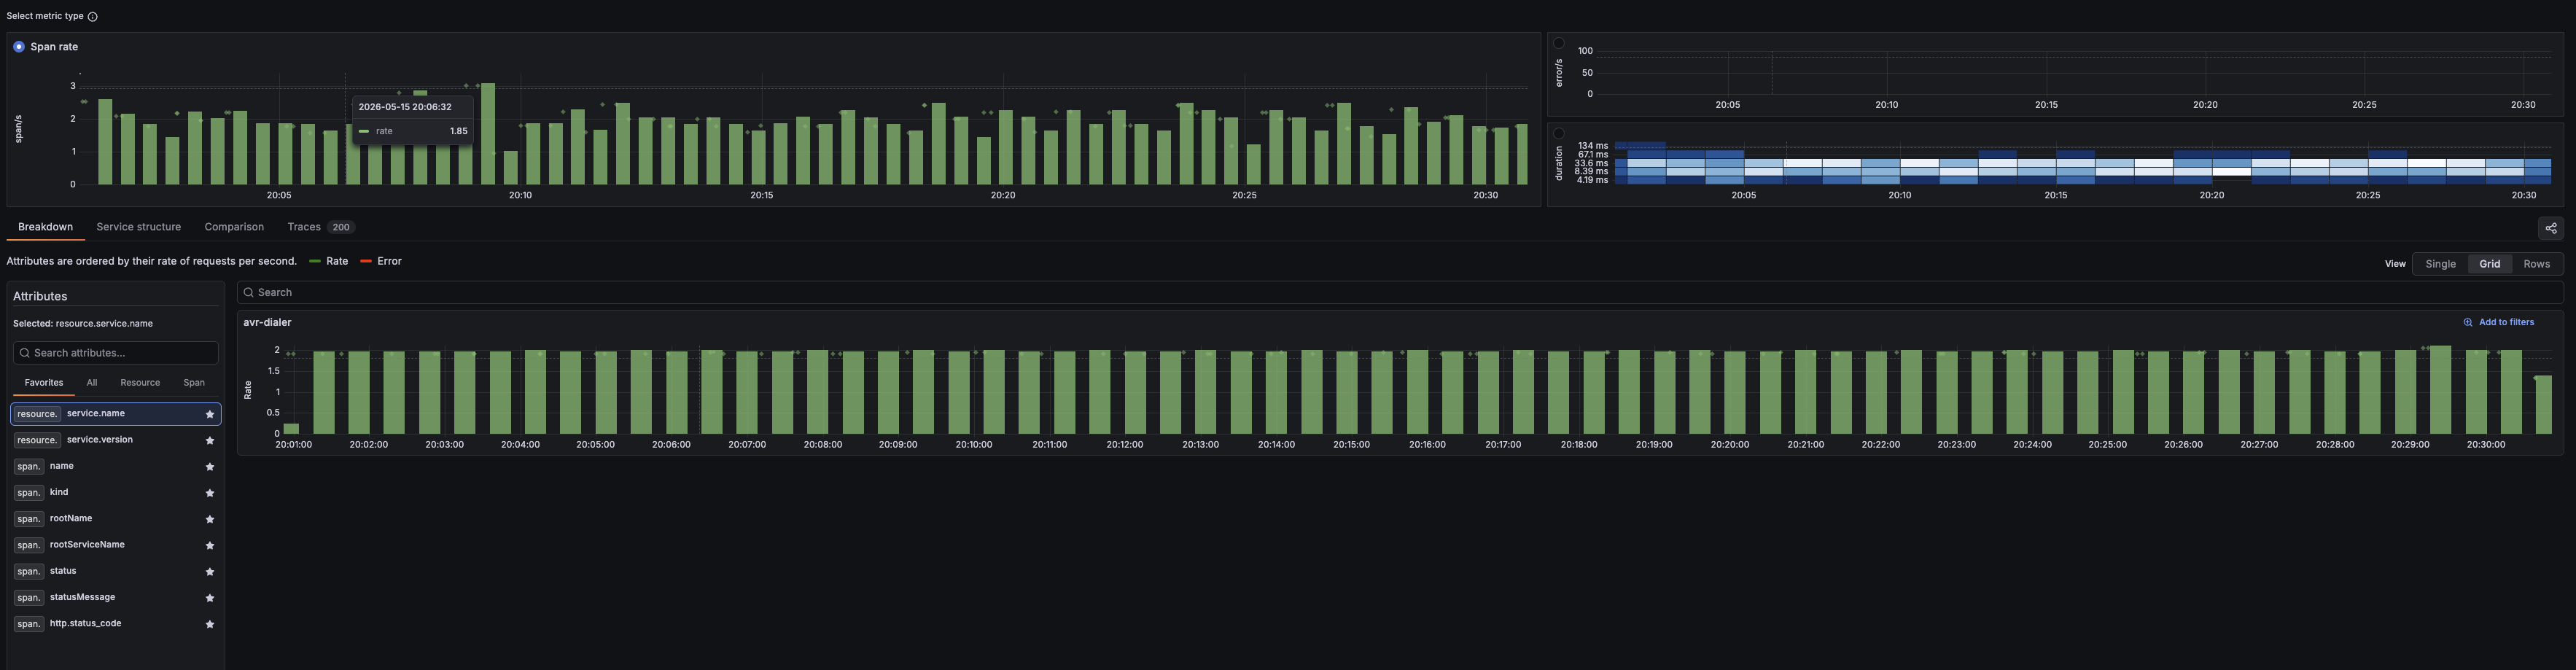
- review spans, service operations, timing, and structured metadata
- correlate logs and traces without jumping between disconnected tools
When to use logs and traces
- a call, campaign, transfer, or API action behaves differently than expected
- a dashboard shows a shift but not the underlying event
- the issue crosses multiple services or external integrations
- timing, latency, or retry behavior needs a concrete explanation
- troubleshooting needs evidence before changing prompts, routing, campaigns, or functions
Practical investigation path
- Start from the symptom in monitoring, call records, or campaign analytics.
- Narrow the time range and the affected route, campaign, contact, trunk, or service.
- Use logs to find the event detail and structured metadata.
- Follow the trace ID when the issue crosses services or needs timing analysis.
- Return to the owning layer with evidence: telephony, workflow logic, runtime, API action, or data.