Pre-Provisioned Dashboards
RocketAiFlow includes pre-provisioned Grafana dashboards so teams can monitor outbound campaigns, telephony, containers, database behavior, and host health from the first deployment.
The Dialer dashboard is the strongest operational view for outbound work: it shows campaign state, live dialing pressure, call limits, outcomes, active calls, and performance over the selected time range.
Dialer dashboard
Use the Dialer dashboard as the main control room for outbound campaigns. It helps operators see whether campaigns are active, whether calls are being generated, how close the system is to the configured call limits, and how outcomes evolve in real time.
The dashboard is easier to explain as four separate views: live campaign control, agent and trunk readiness, all-campaign performance, and single-campaign performance.
Real-Time Overview
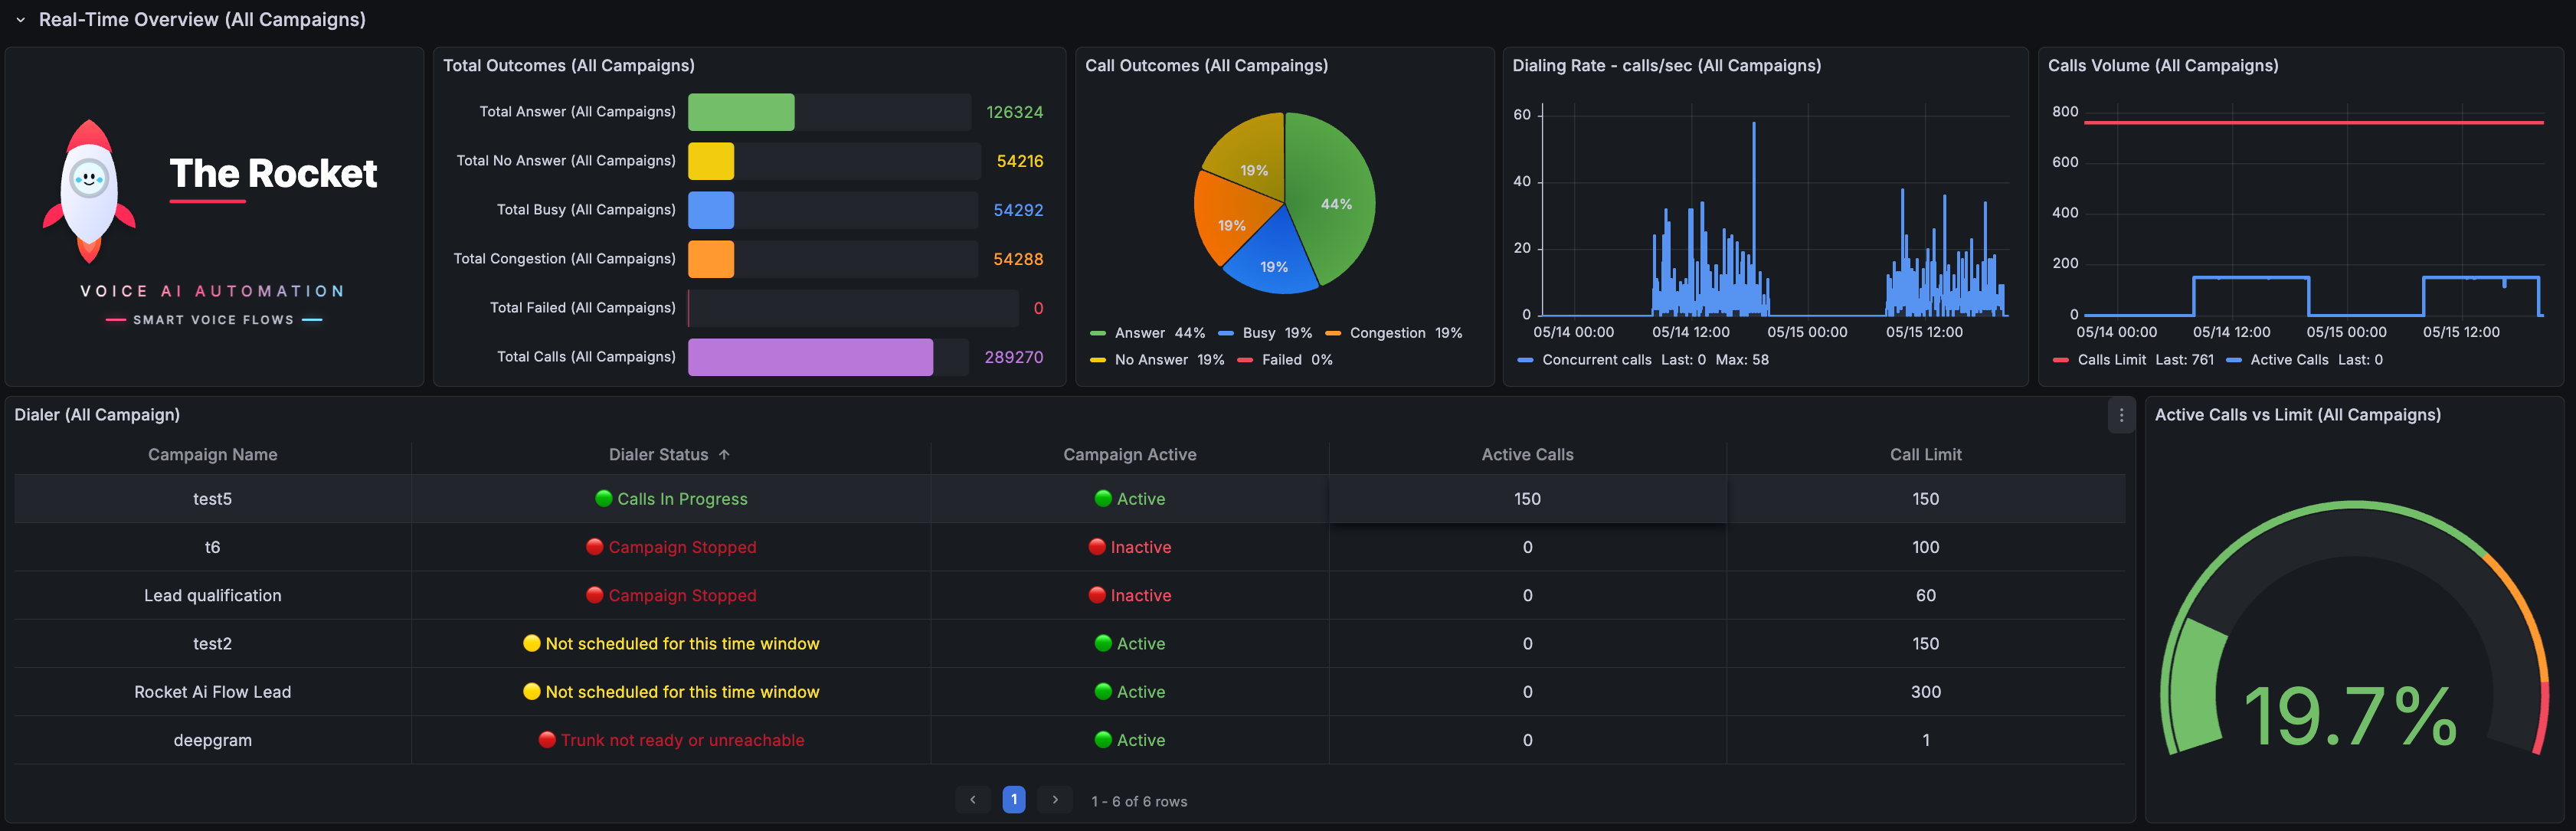
Start here during an outbound run. This view combines live campaign state with outcome totals, dialing pressure, active calls, configured limits, and per-campaign status.
- Use Total Outcomes and Call Outcomes to understand whether the run is producing answers, no answers, busy signals, congestion, or failures. These two panels reset every day.
- Use Dialing Rate and Calls Volume to see whether the dialer is generating traffic at the expected pace.
- Use the Dialer table to compare each campaign status, active flag, active calls, and call limit in one operational list.
- Use Active Calls vs Limit to confirm whether the system is close to saturation or still has capacity available.
Real-Time Agents & Trunks
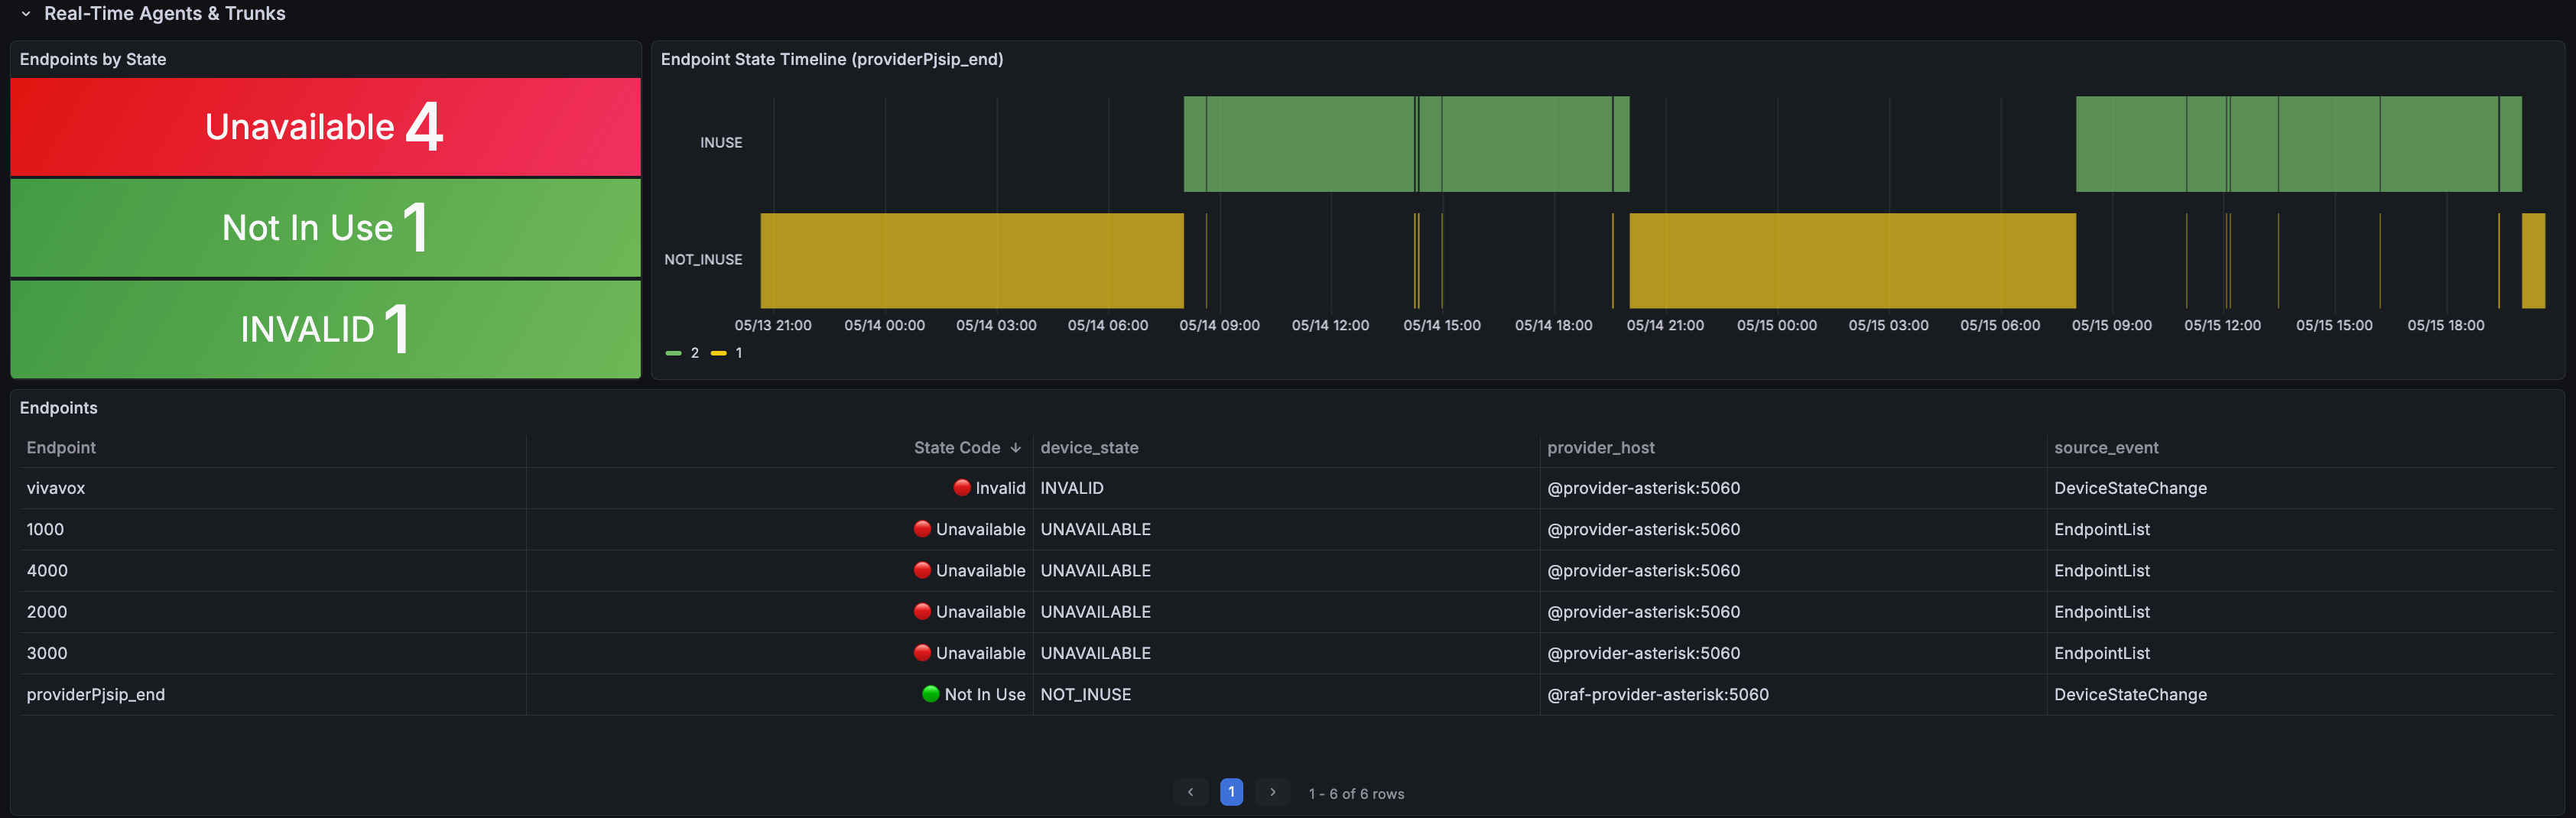
Use this view when the campaign is active but calls are not behaving as expected. It separates campaign logic from telephony readiness by showing endpoint state and timeline changes.
- Use Endpoints by State to quickly see unavailable, Not In Use, invalid, In Use, or other endpoint states.
- Use the Endpoint State Timeline to understand when an endpoint changed state during the selected time range.
- Use the Endpoints table to identify the endpoint, state code, device state, provider host, and source event behind the issue.
- Review this view before changing campaign pacing, because a trunk or endpoint problem can look like a campaign problem.
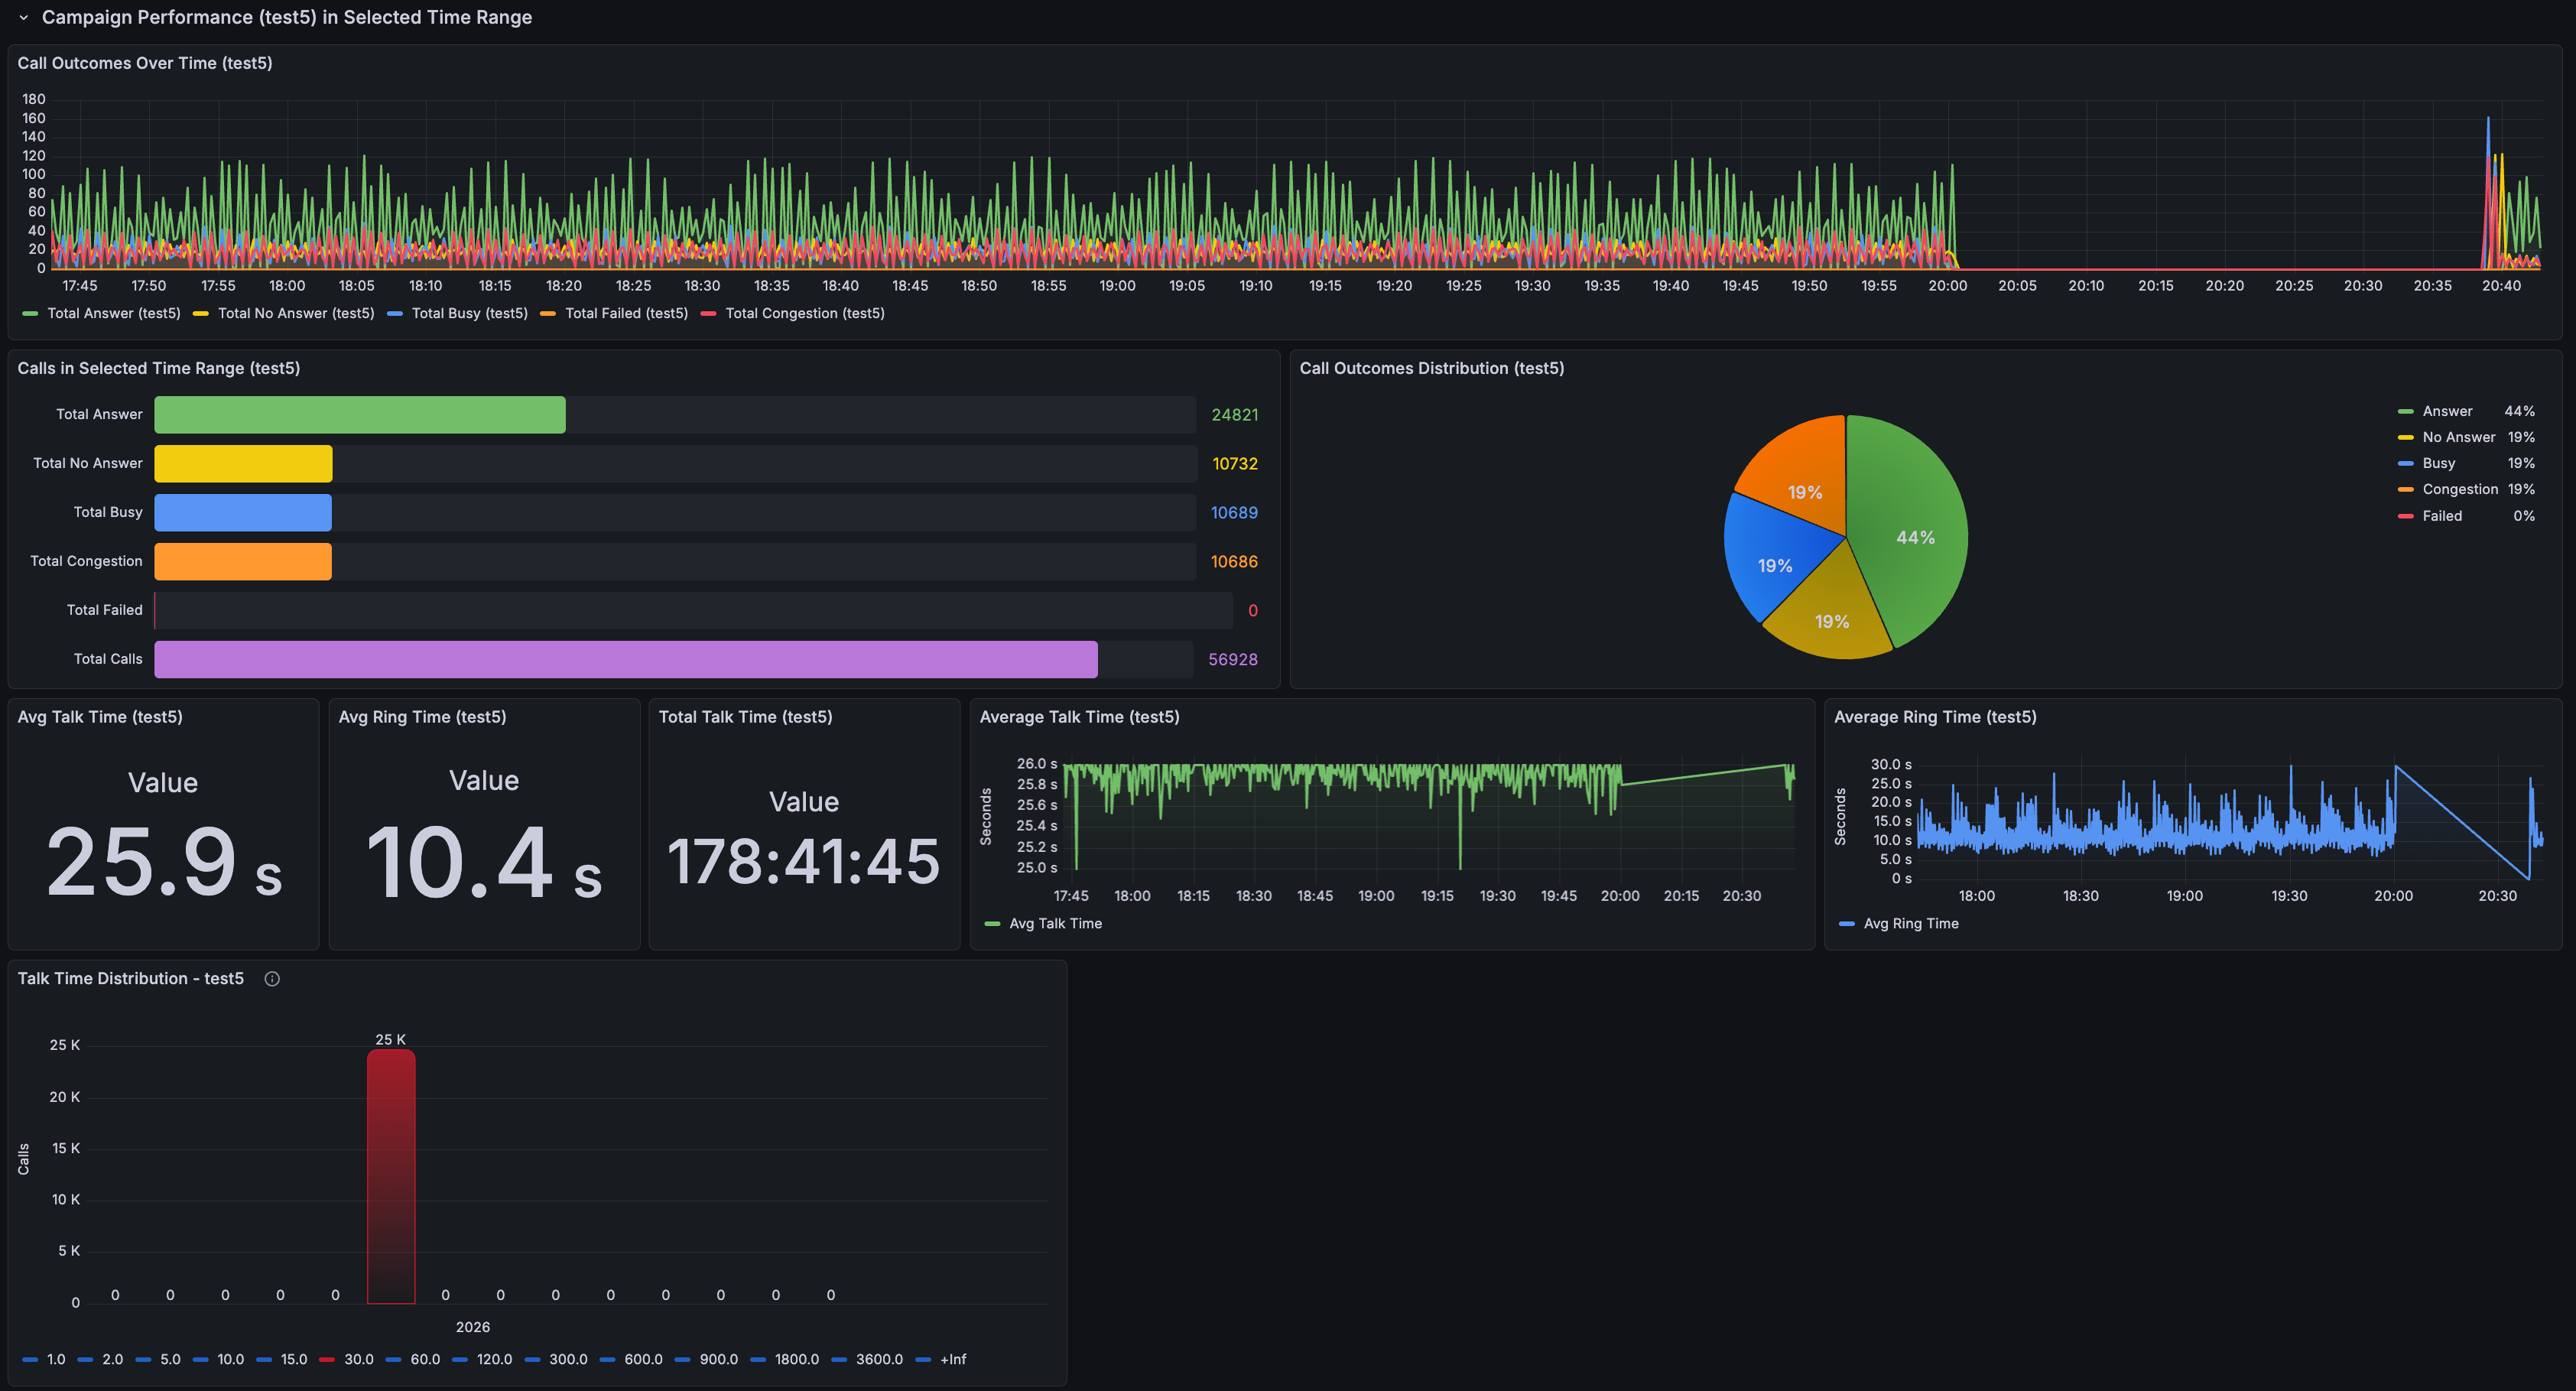
All Campaigns Performance
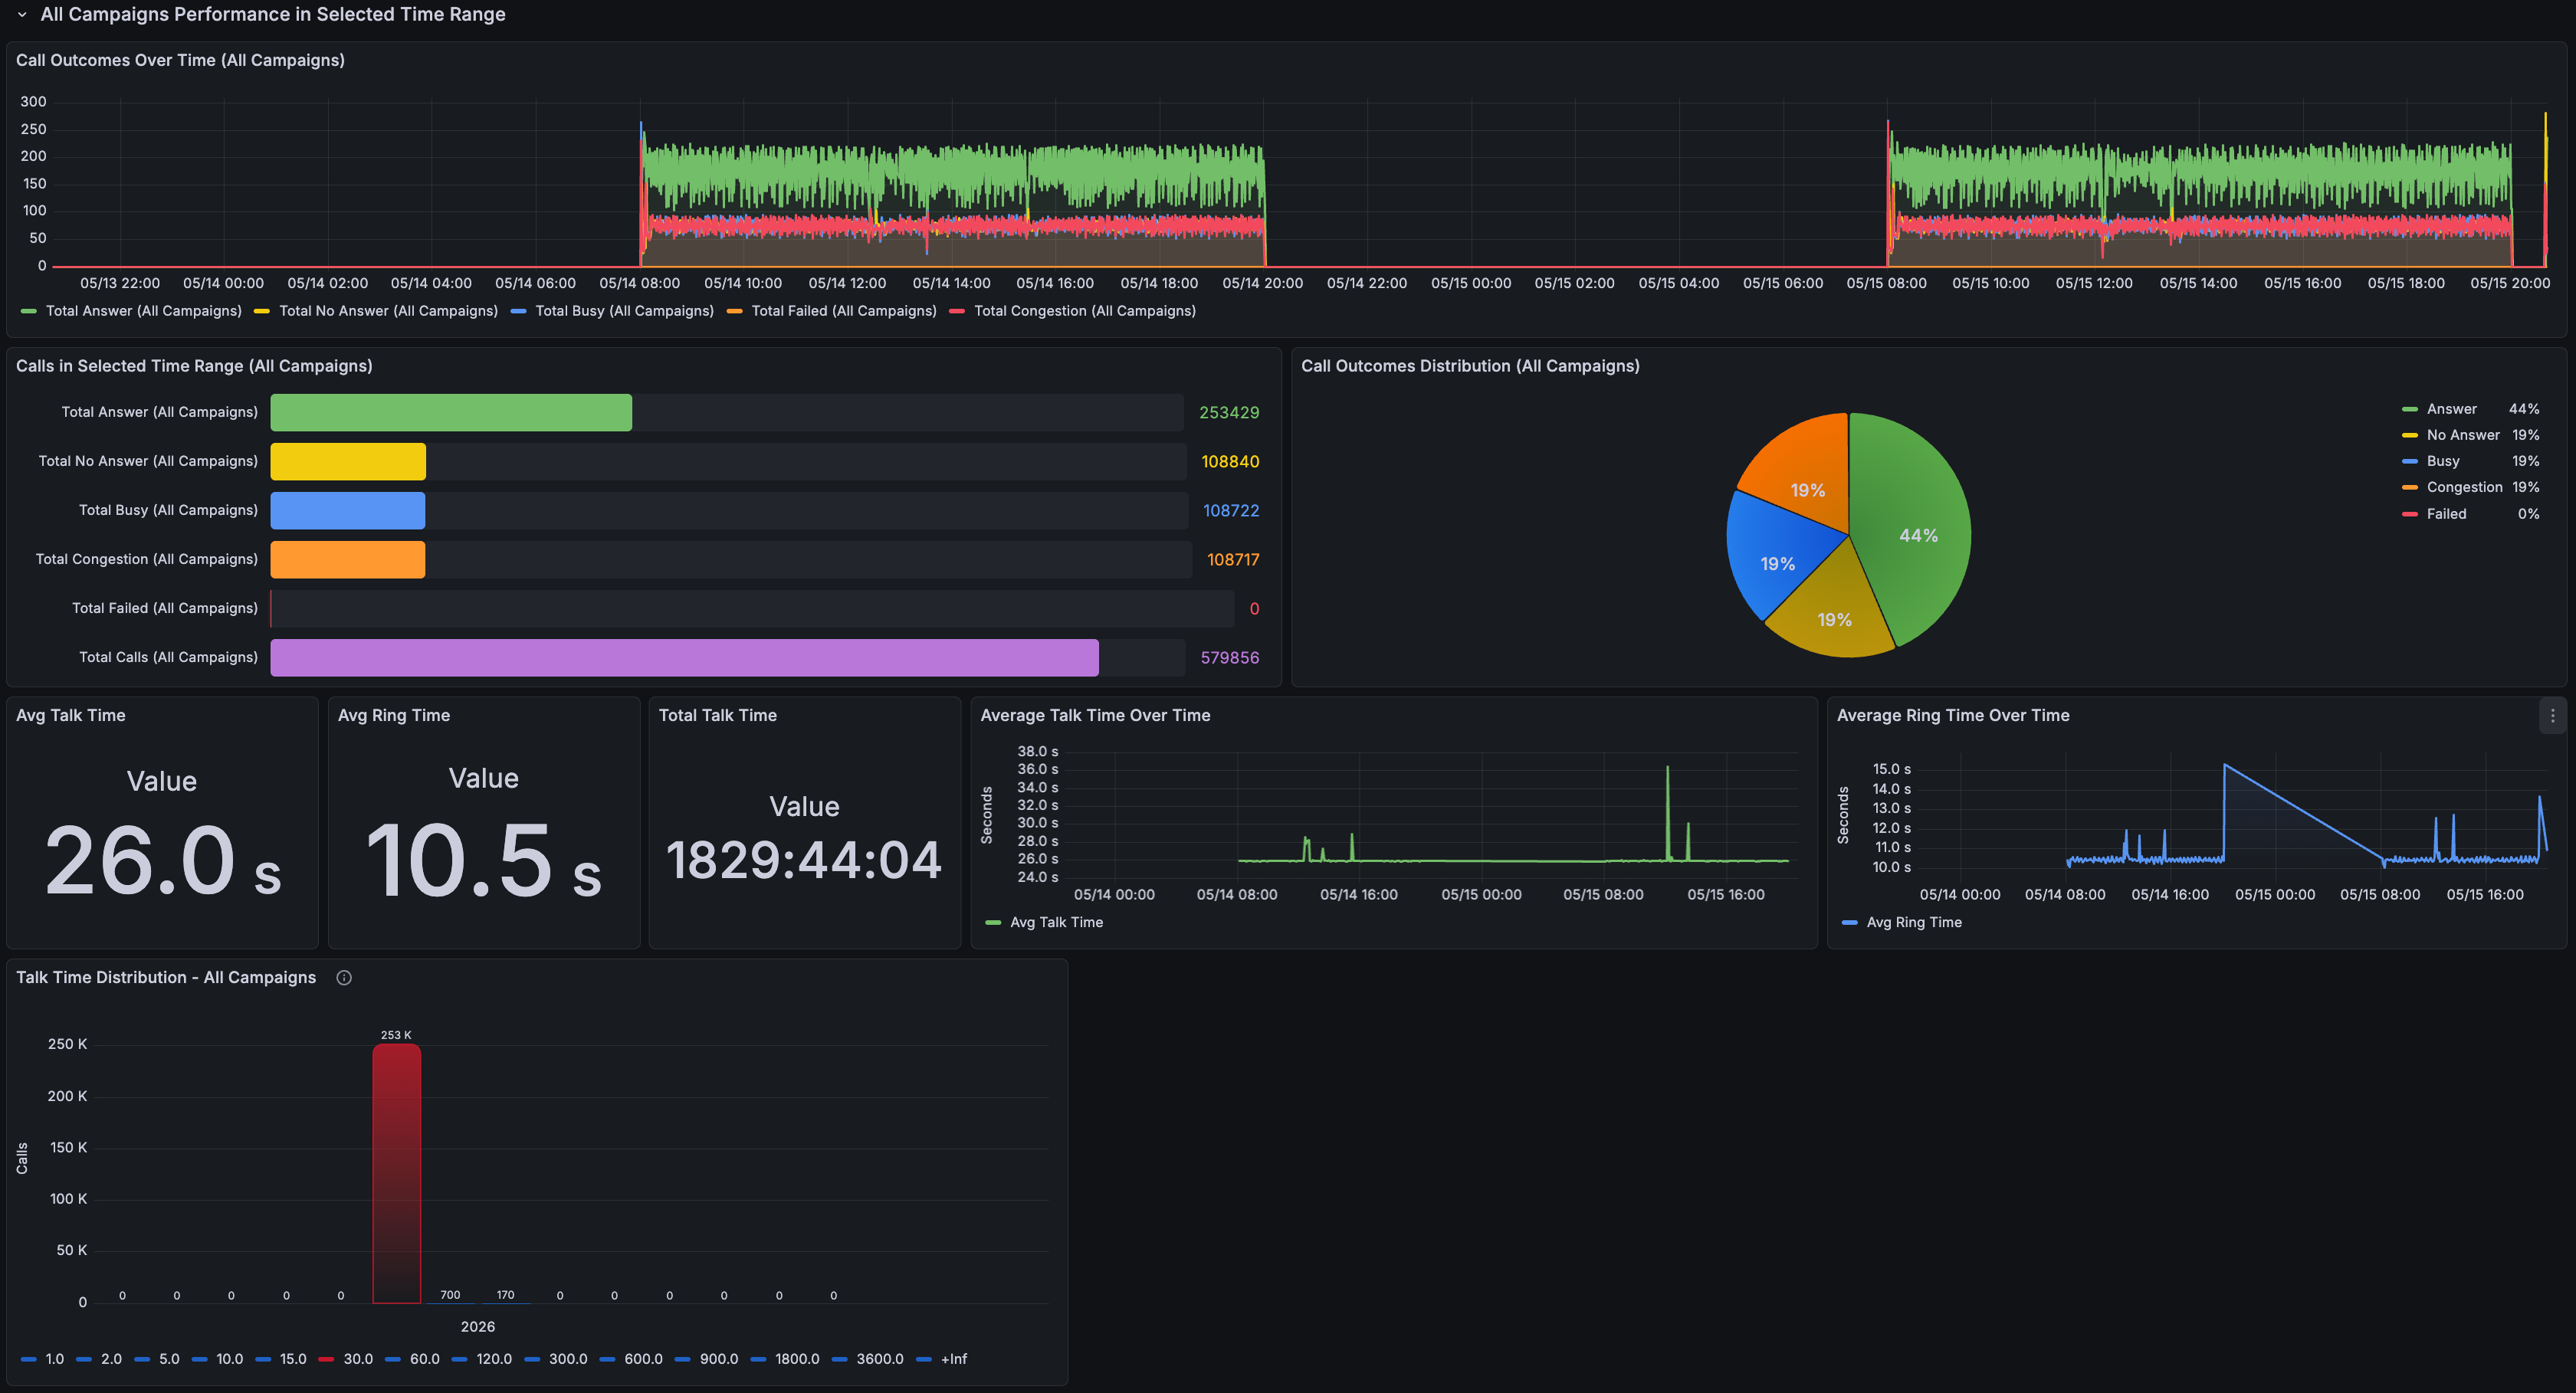
Use this view after or during a wider outbound window when you want to evaluate the combined performance of every campaign in the selected time range.
- Use Call Outcomes Over Time to spot answer, busy, no-answer, congestion, and failure trends across all campaigns.
- Use Calls in Selected Time Range and Call Outcomes Distribution to compare total call volume and outcome mix.
- Use Avg Talk Time, Avg Ring Time, and Total Talk Time to understand conversation quality and operational load.
- Use the talk-time and ring-time charts to detect changes caused by list quality, telephony behavior, or campaign configuration.
Single Campaign Performance
Use this view when one campaign needs its own review. It keeps the same operational metrics as the aggregate view, but filters the analysis to a single campaign.
- Use Call Outcomes Over Time to see the campaign's own answer, busy, no-answer, congestion, and failure pattern.
- Use Calls in Selected Time Range and Call Outcomes Distribution to judge whether the campaign list and pacing are producing the expected outcome mix.
- Use Avg Talk Time, Avg Ring Time, and Total Talk Time to compare this campaign against other outbound runs.
- Use this dashboard before changing the campaign, because it avoids mixing one campaign's behavior with the rest of the dialer traffic.
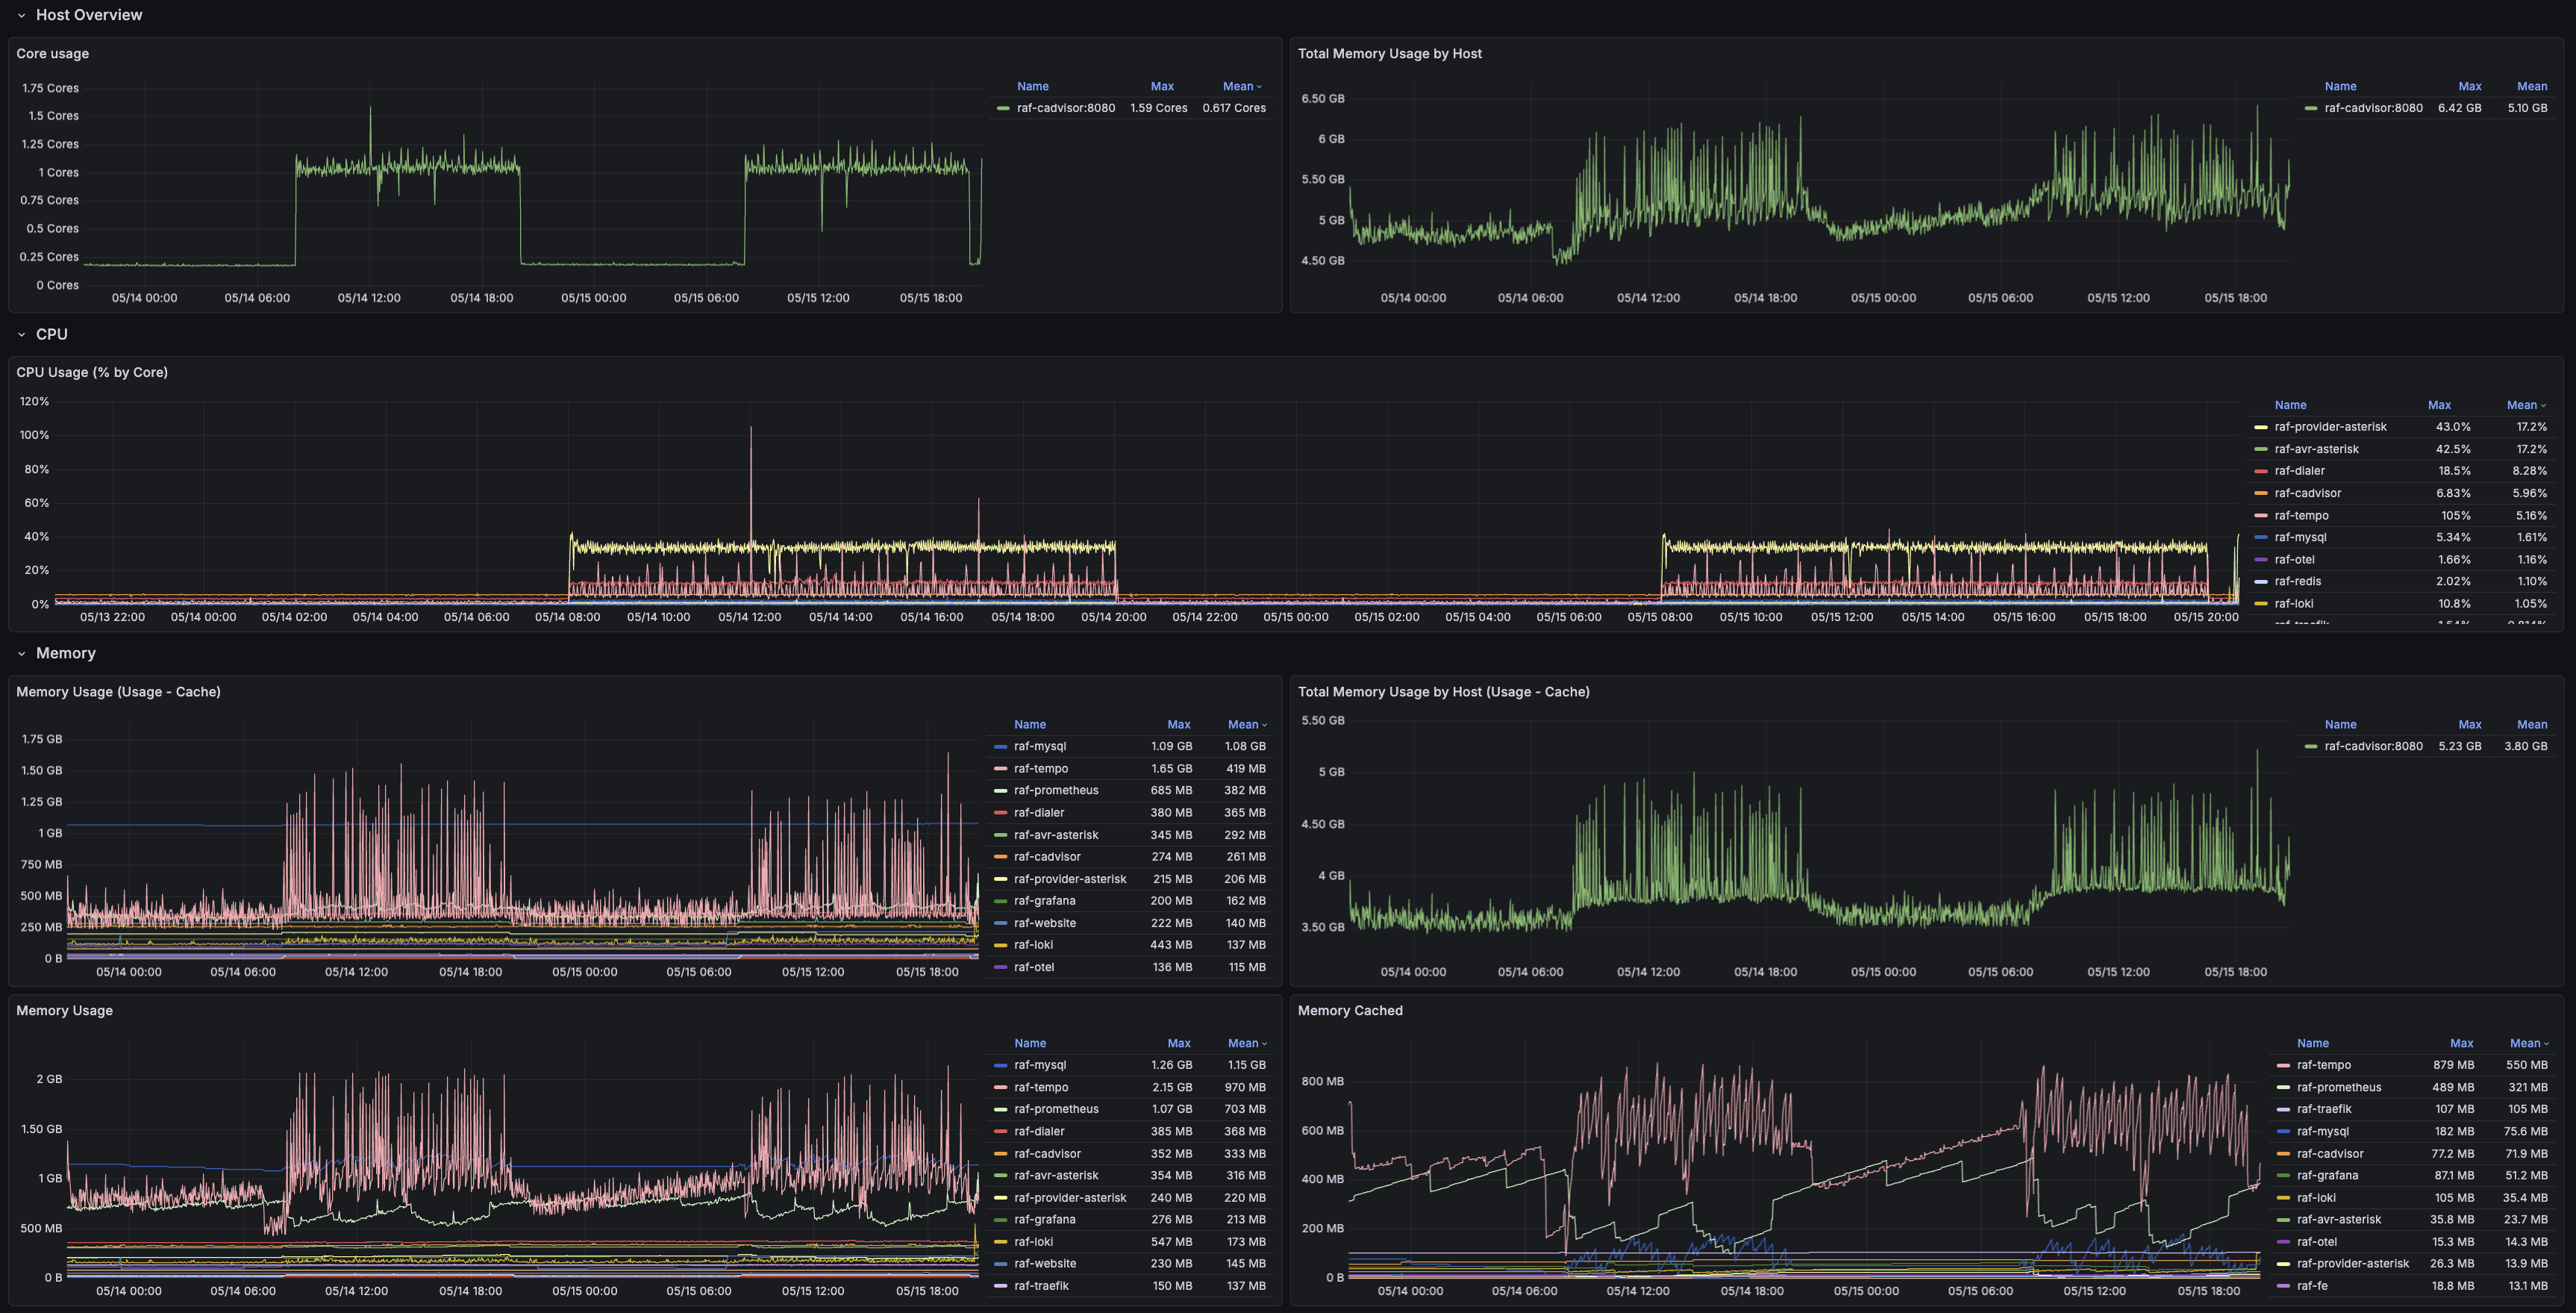
cAdvisor dashboard
Use cAdvisor to understand container-level resource behavior. It helps separate application workflow issues from container pressure, CPU spikes, and memory growth.
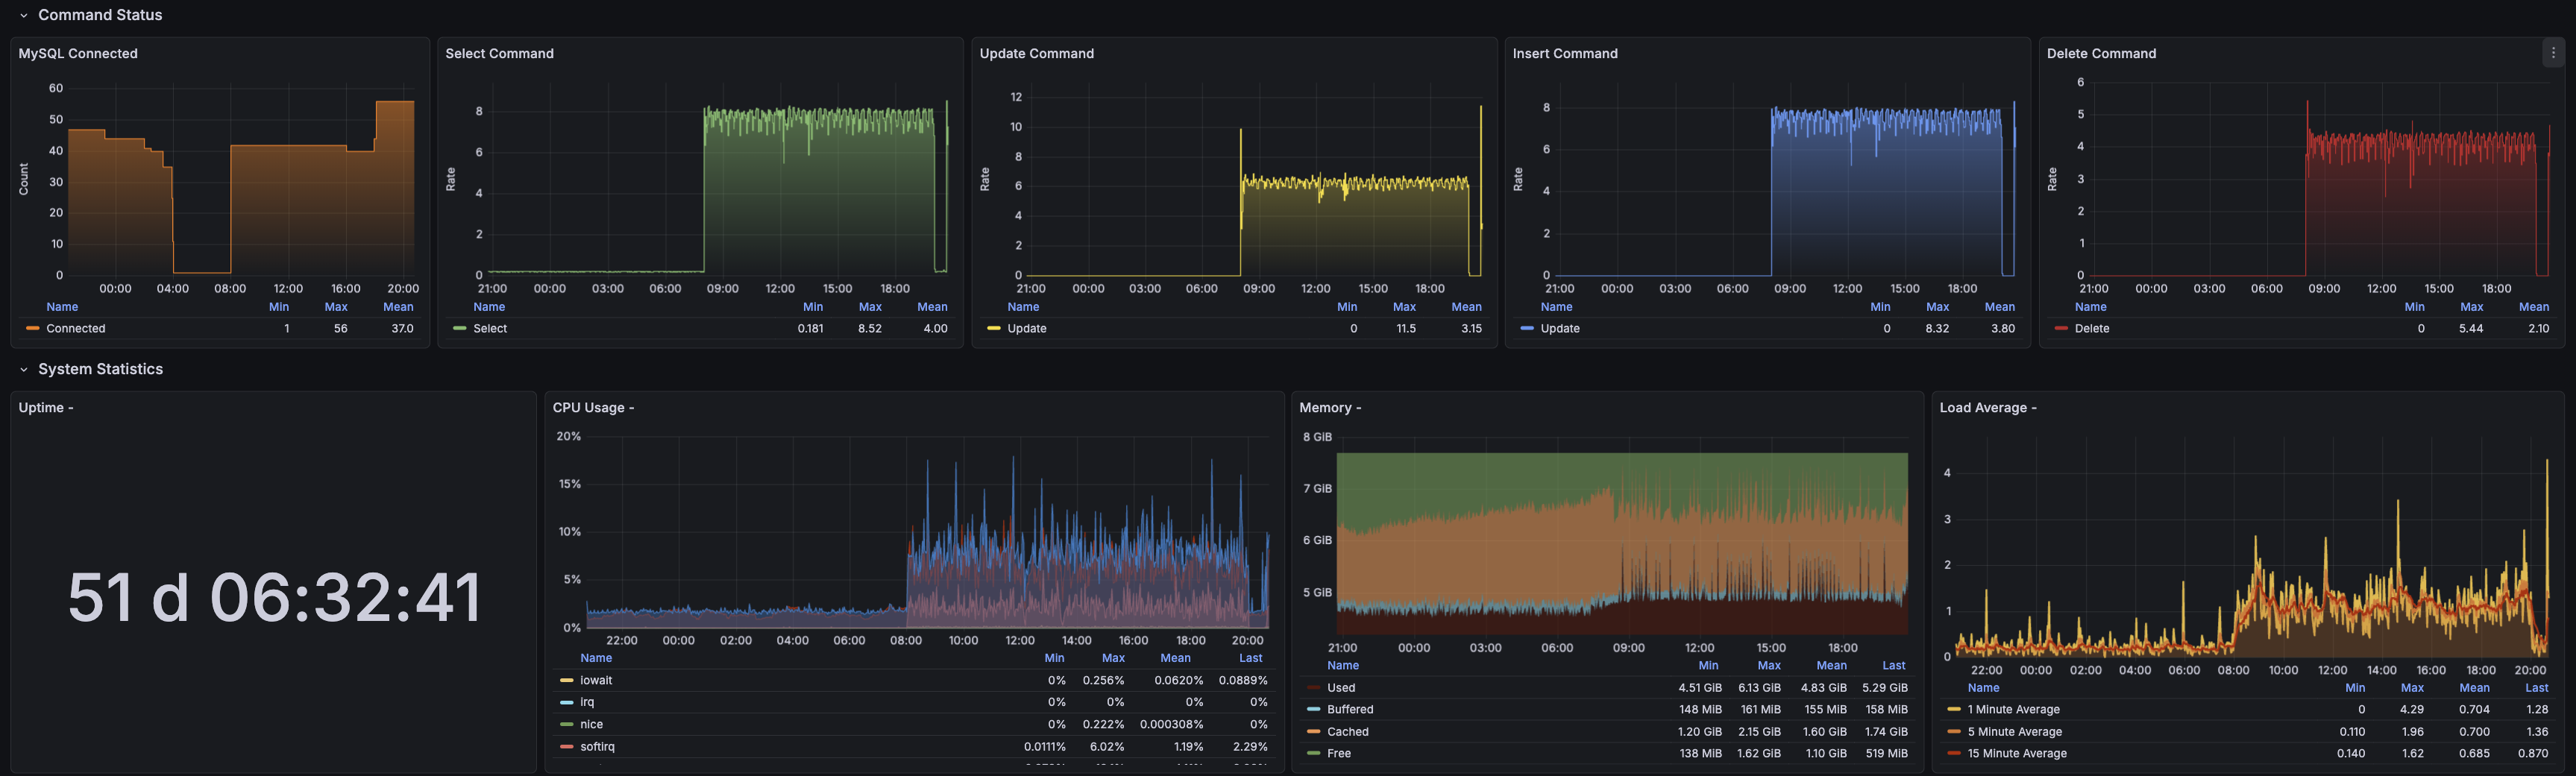
MySQL dashboard
Use the MySQL dashboard when persistence, campaign data, contacts, call records, or backend response time need investigation.
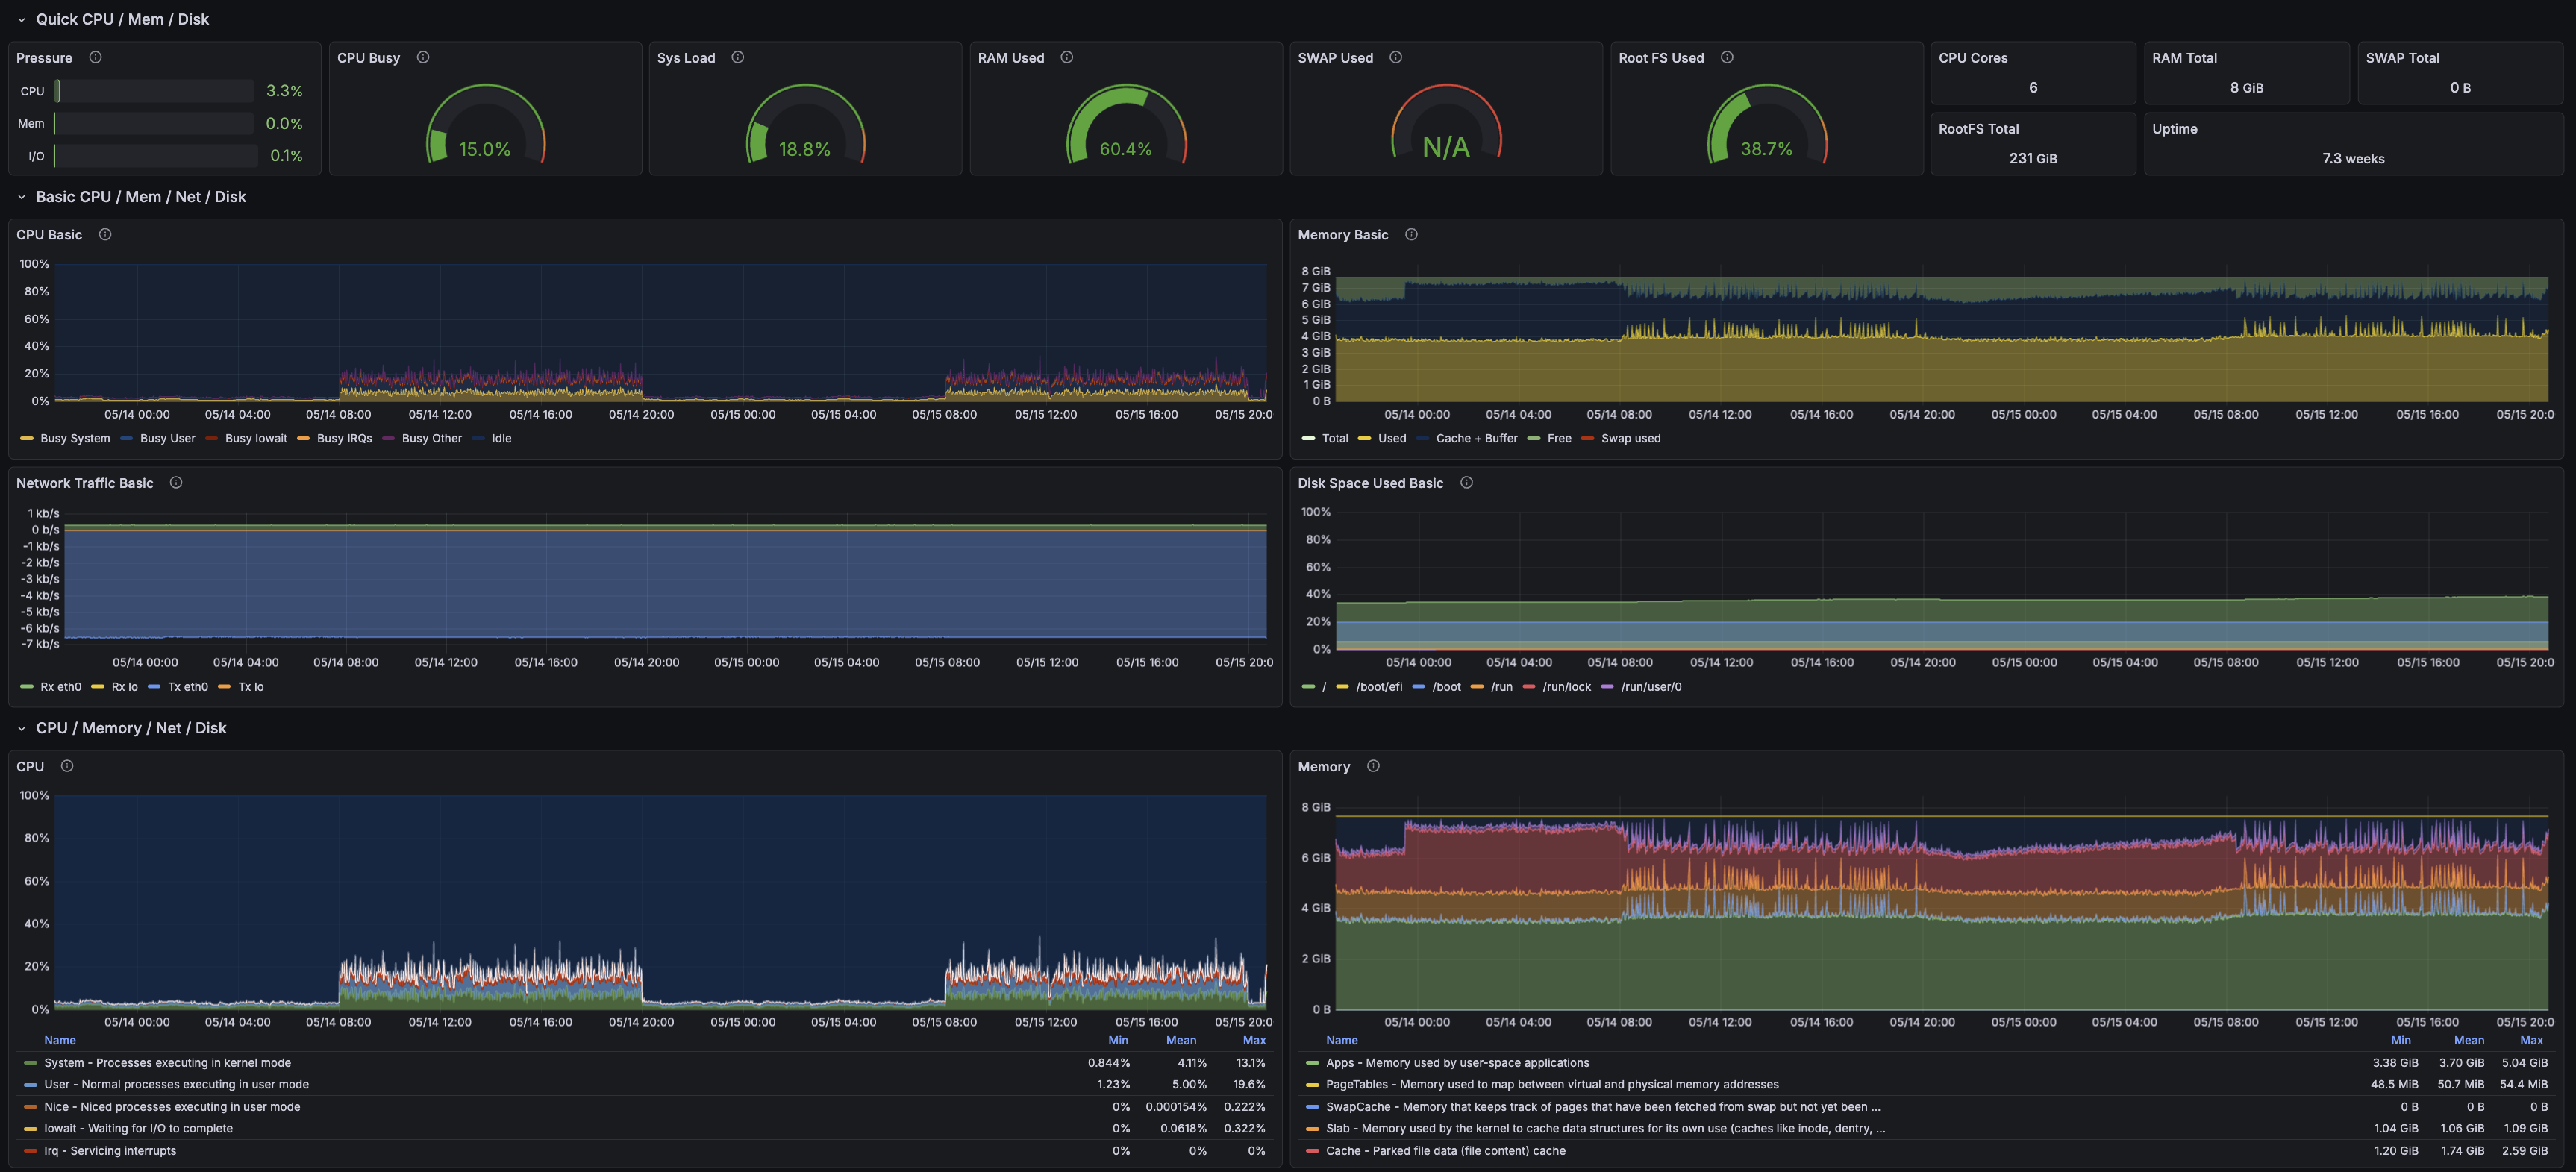
Node Exporter dashboard
Use Node Exporter for host-level health. It gives the baseline view of CPU, memory, disk, network, filesystem usage, and uptime for the server running the platform.
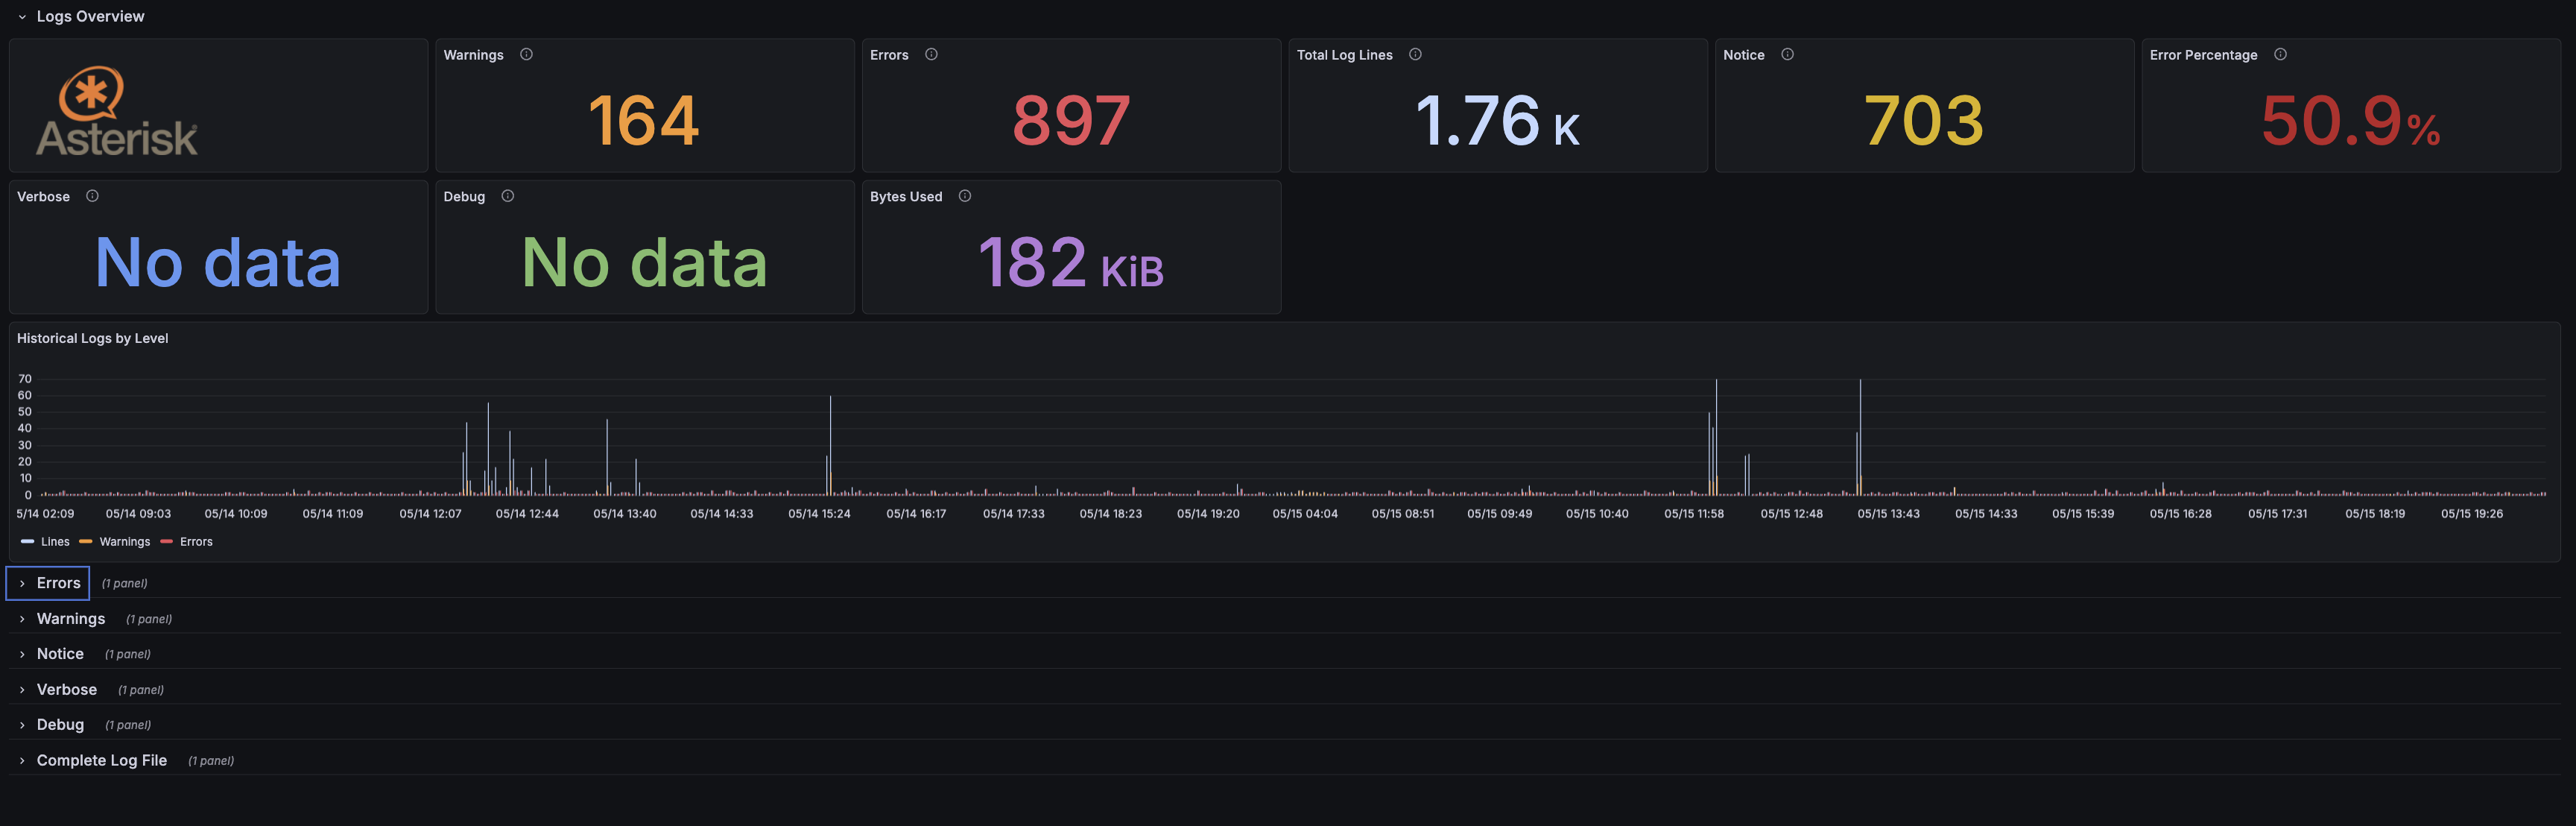
Asterisk Log dashboard
Use Asterisk Log for event-level telephony review. It is useful when calls fail, trunks behave unexpectedly, or warnings and errors need to be checked against a specific time window.
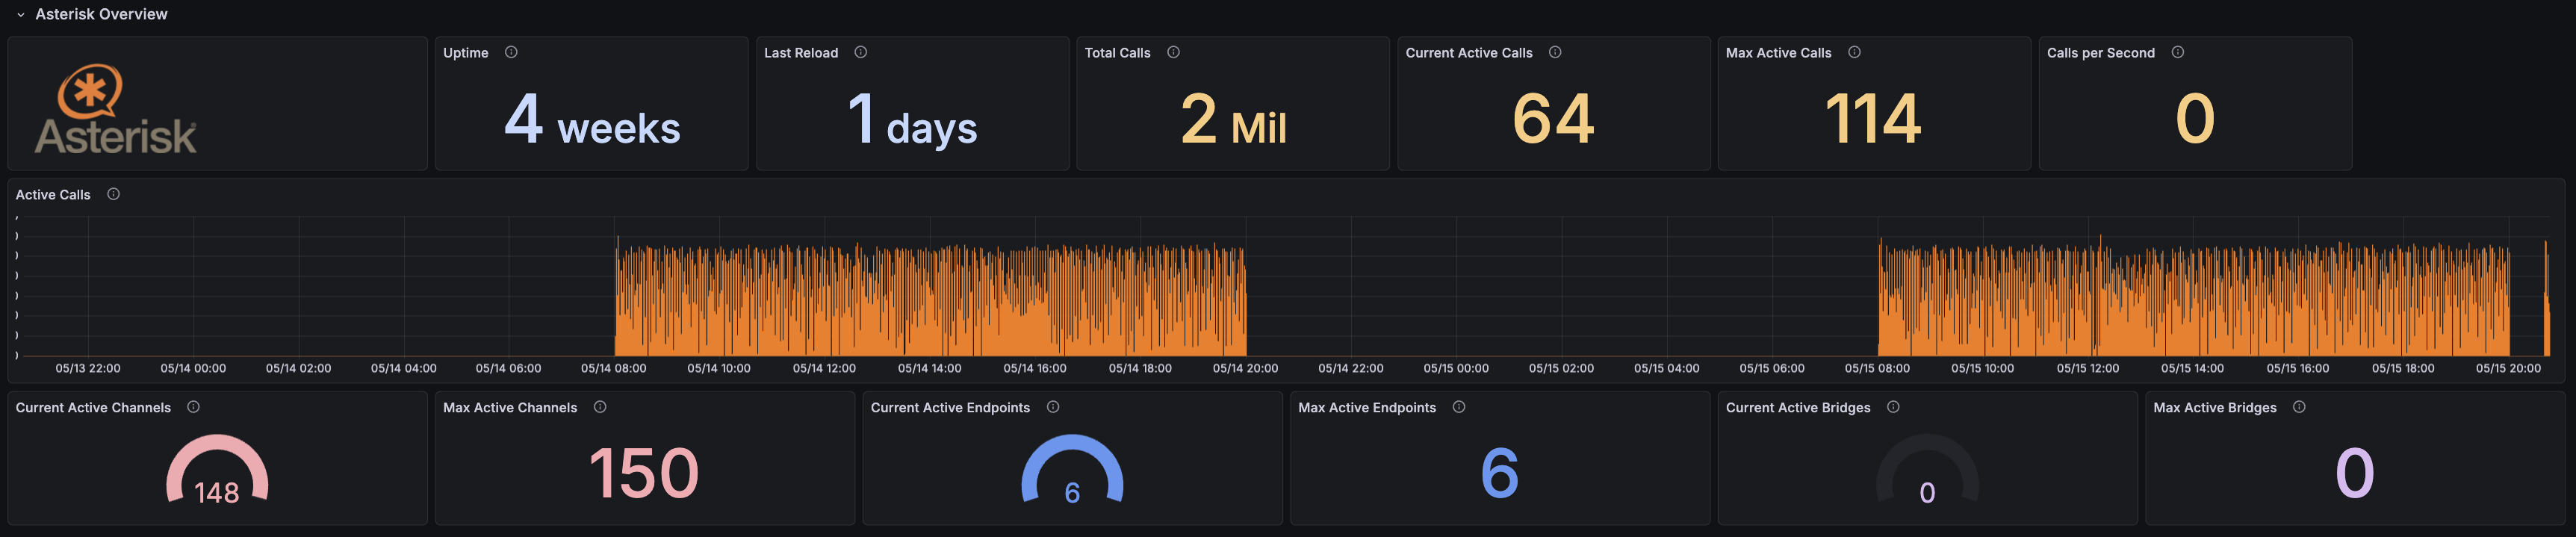
Asterisk Overview dashboard
Use Asterisk Overview for the high-level telephony control plane. It shows Asterisk uptime, reload state, active calls, calls per second, active channels, endpoints, and bridges.